
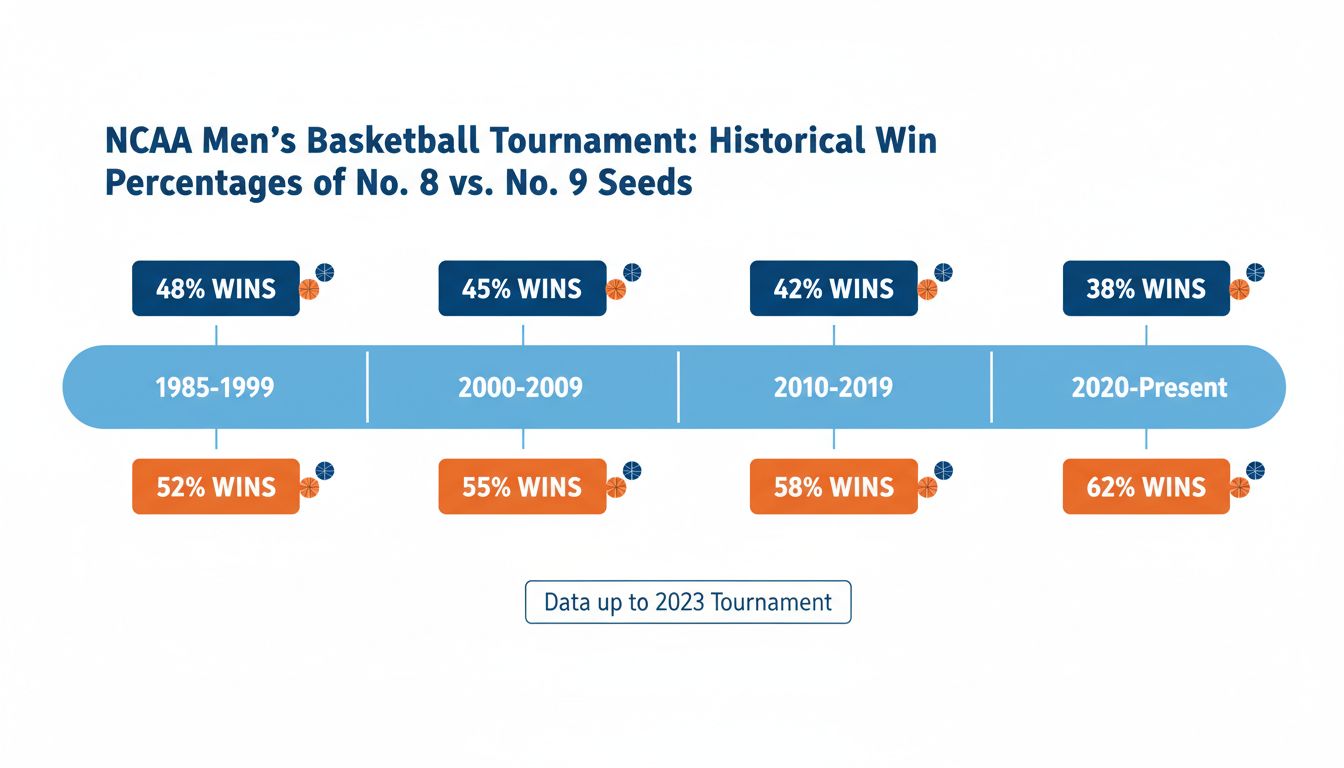
Every March, someone on your group chat insists they have a ",feel" for the 8‑9 games, which is a bit like claiming a psychic edge in calling heads or tails. Since the field expanded in 1985, No. 9 seeds are 83‑77 against No. 8s, which is about as close to literal coin‑flip territory as college basketball gives us. That history matters, but not in the mystical "9s are the new 8s" way it’s often sold. What it really tells us is that the committee clusters roughly similar teams in this band and that any edge is going to be small, noisy, and very easy to overfit with cute narratives. So instead of leaning on vibes, let’s walk through this year’s 8‑9s using the projection model cited in the source material and see what the numbers actually justify.
Start with TCU vs. Ohio State, where history and modeling point in the same direction. TCU has never beaten Ohio State in four tries, and while historical head‑to‑head is mostly trivia, it does underline that these programs usually meet when the Buckeyes have the stronger roster. The projection model has TCU winning only 29% of the simulations, with an expected margin of about seven points in Ohio State’s favor. Translated into betting shorthand, that’s not a coin flip; it’s closer to a team sitting in the -250 moneyline range, where you’d need a very specific edge to fade the favorite. Both teams stumbled out of their conference tournaments, but the model is implicitly telling you that short‑term form isn’t overriding a season‑long signal of Ohio State’s superior underlying quality.

The Villanova‑Utah State matchup is a cleaner example of how humans and models disagree about what matters. Villanova comes in 9‑3 over its last 12, but just 3‑3 in the last six, and fresh off a 14‑point loss to Georgetown in the Big East quarterfinals. Utah State, on the other hand, has won four straight, is 13‑3 in its last 16, and just took the Mountain West title with a double‑digit win over San Diego State. If you only watched March, you’d be tempted to treat Utah State as the classic "hot team" and Villanova as vulnerable, yet the projection model still sides with Villanova and only gives the Aggies a 44% win probability. The quiet driver here is tournament history coupled with program baselines: Villanova has won eight straight first‑round games, while Utah State has exited in the first round in 10 of its last 11 appearances, a reminder that sustained success at this stage often reflects structural advantages that aren’t captured in a one‑week heater.
Of course, we should be careful not to smuggle superstition back in through the side door and call it "experience." Past first‑round failures don’t literally cause future losses, but they do correlate with things like recruiting tier, coaching resources, and depth, which do carry over season to season. When a model leans toward a program like Villanova in a near‑even seed matchup, it’s usually aggregating hundreds of possessions of evidence about efficiency, not whispering about "clutch DNA." If you find yourself saying a team is "due" to break a streak, you’ve officially left the data set and entered theology. In the 8‑9 window, where the signal‑to‑noise ratio is already thin, that’s a dangerous place to build a bracket.

Saint Louis vs. Georgia is where the term "upset" basically loses meaning, even by March standards. Both teams have been erratic: Saint Louis followed an 18‑game winning streak by going 4‑4, while Georgia is 9‑9 since a seven‑game surge and just bowed out early in the SEC tournament. The projection model gives Saint Louis a 52% chance to advance, which is less a bold stand and more a shrug rendered in probability form. Georgia’s five‑game NCAA tournament losing streak, including four straight first‑round exits and six first‑round losses in its last seven trips, tilts the prior just enough toward the Billikens. If you want a rule of thumb here, it’s this: when the model is near 50‑50, any storyline you hear about momentum is almost certainly post‑hoc rationalization layered on top of randomness.
Clemson‑Iowa, the last of this set, is the one that most resembles the public’s intuitive idea of an 8‑9 coin flip, yet the model still finds a small edge. Clemson opened the year by winning 20 of its first 24 but then dropped five of six before stabilizing with a three‑game rebound that ended against Duke in the ACC semifinals. Iowa has its own volatility problem, losing seven of its last 10 and four of its last five, but those losses came against strong opposition, including Nebraska, before a narrow 72‑69 defeat to Ohio State ended its Big Ten run. Historically, Clemson has exited in the first round in seven of its last nine NCAA trips, while Iowa has stumbled in each of its past two but previously strung together four straight first‑round wins. The projection model bakes all of this, plus efficiency data, into a 57% win probability for Iowa, a modest but very real nudge away from the pure 50‑50 fantasy.
So what do we actually do with numbers like 29%, 44%, 52%, and 57% when we’re staring at a blank bracket? First, resist the urge to treat any of these as guarantees; a 57% favorite still loses 43% of the time, which means if you’re shocked when it happens, the problem wasn’t the model, it was your intuition about uncertainty. Second, in contest formats where you need to differentiate from the crowd, tiny edges in 8‑9 games are where you can pick up incremental expected value without betting your entire bracket on a 12‑over‑5 fairy tale. Taking Ohio State and Villanova is basically playing the house side of the model, whereas leaning into Saint Louis and Iowa in their slight‑favorite roles lets you be contrarian only where the edge actually exists. You’re not trying to be the most creative bracket in your pool; you’re trying to be the one that’s least wrong, and in the 8‑9 range, that usually means siding with even mildly stronger priors.
From a broader perspective, these matchups are a useful stress test of how comfortable you are letting data, rather than narratives, drive your decisions. If you catch yourself preferring a team because it feels "hot" or "due," that’s a flag that the storytelling part of your brain is winning a battle the math already settled. Models aren’t omniscient—they can’t see a late injury tweak in warmups or a freshman suddenly playing like an NBA lottery pick—but over large samples they beat our pattern‑seeking instincts by a wide margin. The history of 9‑over‑8 "upsets" is not proof that madness rules March; it’s evidence that when the committee says two teams are close, the outcomes will reflect that closeness. If you treat these games like the glorified coin flips they are, but weight your picks by the small edges the models give you, you’re already ahead of most brackets that were built on nothing more than school colors and nostalgia.
In the end, the healthy way to think about 8‑9 games is that they’re a lab exercise in humility. The data tell you that ninth seeds win slightly more often, but not enough to declare any structural bias in their favor. The simulations suggest specific leanings—Ohio State, Villanova, Saint Louis, Iowa—but openly admit their own uncertainty through those sub‑60% probabilities. Your job as a bracket builder isn’t to outguess variance; it’s to align yourself with it in a way that maximizes your expected return over many tournaments, not just this one. If that sounds less romantic than chasing the perfect Cinderella story, remember: romance doesn’t win you the office pool nearly as often as math does, and math is perfectly happy to be the villain in your bracket’s origin story.